MMM-COVID19-AMPEL
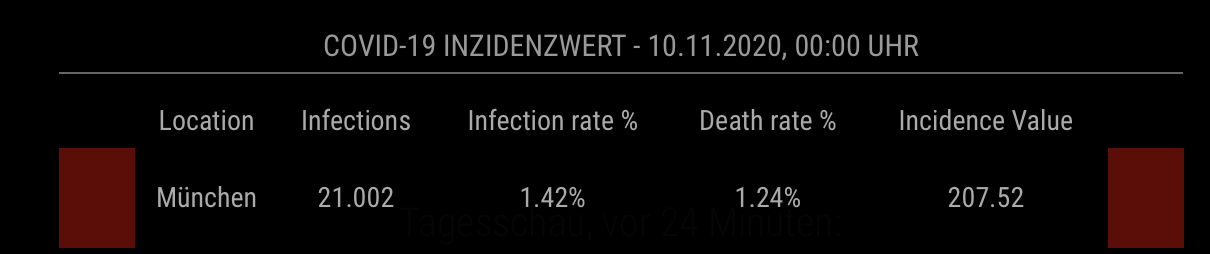
A MagicMirror² helper module to display the COVID 19 INCIDENCE Value in form of the five stages in Germany (Green, Yellow, Red, Dark - Red and Purple).

Installation
In your terminal, go to your MagicMirror's Module folder:
cd ~/MagicMirror/modules
Clone this repository:
git clone https://github.com/magic21nrw/MMM-COVID19-AMPEL.git
run to install needed packages
cd MMM-COVID19-AMPEL
npm install
Add the module to the modules array in the config/config.js file:
  {
    module: "MMM-COVID19-AMPEL"
  },
Configuration options
The following properties can be configured:
| Option | Description |
|---|---|
header |
The header text Default value: 'COVID-19 Inzidenzwert' |
cityID |
The ObjectID of the GEN City from this database in an array: 'https://npgeo-corona-npgeo-de.hub.arcgis.com/datasets/917fc37a709542548cc3be077a786c17_0/data' Go on "map view" at the top right and click the area on the map to get the ObjectID. Possible values: Array: ["224" , "223"] for Ingolstadt and München Default value: ["224"] |
infoRowClass |
The font size of data Possible values: 'small', 'medium' Default value: 'small' |
showUpdateDateInHeader |
Show date of update in Header (of last received item) Possible bool values: true, false Default value: true |
showUpdateDateInRow |
Show date of update in each row Possible bool values: true, false Default value: false |
showStatusLightLeft |
Show status light on left side according to incidence value Possible bool values: true, false Default value: true |
showStatusLightRight |
Show status light on right side according to incidence value Possible bool values: true, false Default value: false |
updateInterval |
How often does the content needs to be fetched? (Milliseconds) Possible values: 1000 - 86400000 Default value: 3600000 (60 minutes) |
showTitle |
Show a title over each column of information provided if you want to show more than one information. Possible bool values: true, false Default value: true |
showSKLK |
Switch for displaying the additional information for the place if it is a city area or regional area (Stad or Landkreis) Possible bool values: true, false Default value: true |
showCases |
Show total number of people infected Possible bool values: true, false Default value: true |
showCasesPerPeople |
Show % of cases per people in this city/region Possible bool values: true, false Default value: true |
showDeathRatePerPeople |
Show death rate of people Possible bool values: true, false Default value: true |
show7DayIncidence |
Show 7 day incidence value which corresponds to the status light Possible bool values: true, false Default value: true |
showVaccinations |
Show quota of first shot vaccinations in header as well for whole Germany. Possible bool values: true, false Default value: true |
numberOfDigits |
Number of digits for percentage values to show. Possible int values: 0, 1 or 2 Default value: 2 |
landModeOnly |
Shows only values for the Bundesland instead of the selected region. Example: If City Munich is selected and landModeOnly is true, Bayern will be displayed instead of Munich. Default value: false |
fadeSpeed |
Fading speed when module is updating. No need to change it... Possible values: 1000 - 86400000 Default value: 4000 |
Config Example
{
  module: 'MMM-COVID19-AMPEL',
  position: 'top_center',
  config:	{
    header: 'COVID-19 Inzidenzwert', // Header Title of Display on MagicMirror
    cityID: ["224","223"], // City ID from  https://npgeo-corona-npgeo-de.hub.arcgis.com/datasets/917fc37a709542548cc3be077a786c17_0/data
    infoRowClass: "small", // small, medium
    showUpdateDateInHeader: true, //Show update date in header
    showUpdateDateInRow: false, //Show update date in each row
    showStatusLightLeft: true, //Show left status light
    showStatusLightRight: true, // Show right status light
    showTitle: true, //Show Title row with headlines if you want to display more than one information
    showSKLK: true, //Show the Region information if the Pace displayed is the city or regional area (Stadt or Land)
    showCases: true, //Show amount of active cases in city
    showCasesPerPeople: true, //Show Percentage of active cases per inhabitant
    showDeathRatePerPeople: true, //show death rate in % of infected people
    show7DayIncidence: true, // Show 7 day incidence value for your location
    landModeOnly: false, // Shows Bundesland instead of City in Bundesland (Thos who want to display only the Bundesland)
    showVaccinations: true, //Shows the total quota of fist shots people got in the whole country in header
    numberOfDigits: 2, //Round the Percentage and incidence value to number of digits
    updateInterval: 3600000, // update interval in milliseconds // 1 Hour - Values are only refreshed every 24 H on Server
    fadeSpeed: 4000
	}
},
Updating
To update the module to the latest version, use your terminal to go to your MMM-COVID19-AMPEL module folder and type the following command:
git pull && npm install
Feel free to open any Issue 😃